Test Example |
A simple test unit example about SIC Draw Line Chart
Topics about Testing
Testing concept go to here (e.g. structure, name syntax)
Programming a test unit go to here (code and example)
Some log entries are not necessary. These serve as an explanation. |
Test case for draw a line chart.
lLineChart = new LineChart();

//* draws chart *
lLineChart.Create(lTestFile, lXAxis, lYAxis, lPoints, LineChartType.Line,
                  pViewXAxis: SIC.Draw.AxisDisplay.Labels,
                  pViewYAxis: SIC.Draw.AxisDisplay.Labels,
                  pBorderSpacing: 55,     //* correction for label view *
                  pXLabelSpacing: 27,     //* correction for label view *
                  pShowScaling: false,    //* test case: scaling then on true *
                  pXLabel: "X Label",
                  pYLabel: "Y Label"
                  );
Test Project
Create a test project (SOWI Test Project template) or go to exists a test project.
Add assembly SIC.Draw as a reference in the project
Test Unit
Create a test unit (project item template called SOWITestUnit or go to exists test unit
Go to tasks token UNDONE. For this example, the lines can be deleted.
Test Case
Create a test case (code snippet scsTestCase)
Implement section "Preparation"
C##region --- Preparation --- this.Log.WriteTitle("TEST PREPARATION"); this.Log.Write("Test variable..."); SIC.Draw.LineChart lLineChart = null; List<SIC.Draw.Axis> lXAxis = null; List<SIC.Draw.Axis> lYAxis = null; List<SIC.Draw.Point> lPoints = null; string lTestFile = this.ResultDirectory + this.Log.Name; //--- // TOSET: test values and correct result values //* x axis * lXAxis = new List<SIC.Draw.Axis>(); lXAxis.Add(new SIC.Draw.Axis(10, "left")); lXAxis.Add(new SIC.Draw.Axis(20, "middle")); lXAxis.Add(new SIC.Draw.Axis(30, "right")); lXAxis.Add(new SIC.Draw.Axis(25, "between")); //* test case: correct sorted * //* y axis * lYAxis = new List<SIC.Draw.Axis>(); lYAxis.Add(new SIC.Draw.Axis(30, "up")); lYAxis.Add(new SIC.Draw.Axis(20, "middle")); lYAxis.Add(new SIC.Draw.Axis(10, "down")); lYAxis.Add(new SIC.Draw.Axis(15, "between")); //* test case: correct sorted * //* chart values * lPoints = new List<SIC.Draw.Point>(); lPoints.Add(new SIC.Draw.Point(10, 10)); lPoints.Add(new SIC.Draw.Point(13, 18)); lPoints.Add(new SIC.Draw.Point(20, 20)); lPoints.Add(new SIC.Draw.Point(25, 22)); lPoints.Add(new SIC.Draw.Point(30, 30)); //--- string lTestFileResult = ""; //* protocol test preparation * this.Log.Write("Test file name", "\t" + lTestFile); lXAxis.ForEach(delegate (SIC.Draw.Axis pAxis) { this.Log.Write("X Axis \t Value: \t" + pAxis.Value.ToString() + "\t Label: " + pAxis.Label); }); lYAxis.ForEach(delegate (SIC.Draw.Axis pAxis) { this.Log.Write("Y Axis \t Value: \t" + pAxis.Value.ToString() + "\t Label: " + pAxis.Label); }); lPoints.ForEach(delegate (SIC.Draw.Point pPoint) { this.Log.Write("Point \t X: \t" + pPoint.X.ToString() + "\t Y: " + pPoint.Y.ToString()); }); this.Log.Write("Test prepared"); #endregion
Implement section Execution
C##region --- Execution --- this.Log.WriteTitle("TEST EXECUTION"); this.Log.Write("Crate Line Chart..."); this.Log.TestStart(); try { lLineChart = new LineChart(); //* draws chart * lLineChart.Create(lTestFile, lXAxis, lYAxis, lPoints, LineChartType.Line, pViewXAxis: SIC.Draw.AxisDisplay.Labels, pViewYAxis: SIC.Draw.AxisDisplay.Labels, pBorderSpacing: 55, //* correction for label view * pXLabelSpacing: 27, //* correction for label view * pShowScaling: false, //* test case: scaling then on true * pXLabel: "X Label", pYLabel: "Y Label" ); lTestFileResult = lLineChart.File; } catch (Exception ex) { this.Log.IsTrue(ref ex); } this.Log.TestEnd(); //* protocol test execution * this.Log.Write("Test result file name", lTestFileResult); this.Log.Write("Test executed"); #endregion
Implement section Test Analysis
C##region --- Analysis --- this.Log.WriteTitle("TEST ANALYSIS"); //* conditions * this.Log.IsTrue(lXAxis != null, "X axis object is null", "X axis object OK"); this.Log.IsTrue(lYAxis != null, "Y axis object is null", "Y axis object OK"); this.Log.IsTrue(lPoints != null, "Points object is null", "Points object OK"); this.Log.IsTrue(lLineChart != null, "Line Chart object is null", "Line Chart object OK"); this.Log.IsTrue(System.IO.File.Exists(lTestFileResult), "No exists test file. Result value: " + lTestFileResult.ToString(), "Result file OK"); //* write result of conditions * this.Log.Result(); #endregion
Test Result
Test Window
Test Name:        TestSICDrawLineChart
Test Outcome:        Passed
Result StandardOutput:
Debugablaufverfolgung:
-------------------------
TestInitialize
Event OnDirectorySetting...
Directory initialize to below values:
    Data Redirecting:            C:\Work\Data\
    Data Redirect:               False
    Result Redirecting:          C:\Work\
    Result Redirect:             True
Initialize Log object...
Test result directory:          C:\Work\
Event OnSessionSetting...
Session token reset (token not available)
Event OnTestInitialize...
None
-------------------------
TestSICDrawLineChart on 20170625233024

TEST PREPARATION
Test variable...
Test result directory:          C:\Work\
Test file name:                  C:\Work\TestSICDrawLineChart on 20170625233024
X Axis          Value:         10         Label: left
X Axis          Value:         20         Label: middle
X Axis          Value:         30         Label: right
X Axis          Value:         25         Label: between
Y Axis          Value:         30         Label: up
Y Axis          Value:         20         Label: middle
Y Axis          Value:         10         Label: down
Y Axis          Value:         15         Label: between
Point           X:             10         Y: 10
Point           X:             13         Y: 18
Point           X:             20         Y: 20
Point           X:             25         Y: 22
Point           X:             30         Y: 30
Test prepared

TEST EXECUTION
Create Line Chart...
Test result file name:          C:\Work\TestSICDrawLineChart on 20170625233024.jpeg
Test executed

TEST ANALYSIS
Test outcome:          Passed
Test duration:          00:00:00.0435928
X axis object OK
Y axis object OK
Points object OK
Line Chart object OK
Result file OK

-------------------------
TestCleanup
None
Test Result File
TestSICDrawLineChart on 20170625233024

TEST PREPARATION
Test variable...
Test result directory:          C:\Work\
Test file name:                  C:\Work\TestSICDrawLineChart on 20170625233024
X Axis          Value:         10         Label: left
X Axis          Value:         20         Label: middle
X Axis          Value:         30         Label: right
X Axis          Value:         25         Label: between
Y Axis          Value:         30         Label: up
Y Axis          Value:         20         Label: middle
Y Axis          Value:         10         Label: down
Y Axis          Value:         15         Label: between
Point           X:             10         Y: 10
Point           X:             13         Y: 18
Point           X:             20         Y: 20
Point           X:             25         Y: 22
Point           X:             30         Y: 30
Test prepared

TEST EXECUTION
Create Line Chart...
Test result file name:          C:\Work\TestSICDrawLineChart on 20170625233024.jpeg
Test executed

TEST ANALYSIS
Test outcome:          Passed
Test duration:          00:00:00.0435928
X axis object OK
Y axis object OK
Points object OK
Line Chart object OK
Result file OK
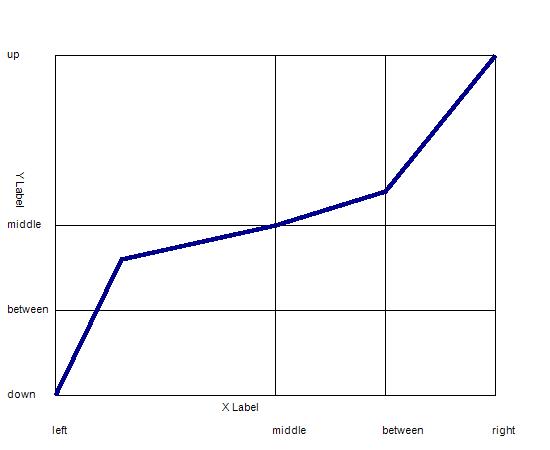
Test Result File (Line Chart)